1.0 Overview
I have created a Mule application that pings URL to ensure that they are up, and if the URL is down for some reason the Mule Application is capable of sending out email notification. At the time of this writing the Mule application could send out email notification, I plan to incorporate more types of notification as I continue to improve it.
The source code is fully obtainable via the following github link.
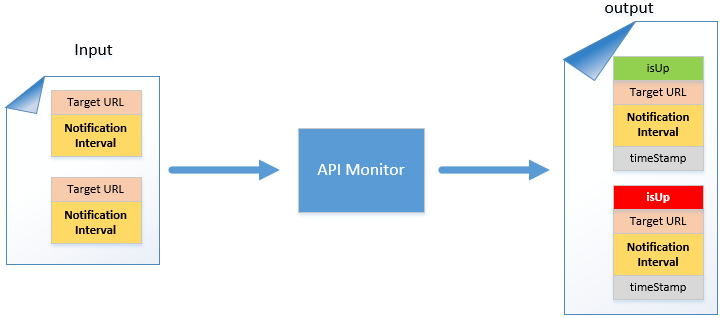
Figure 1.0
Figure 1.0 shows an abstract diagram on what the API monitor expects. Users would submit a json payload consisting of an array of target urls to be pinged by API monitor. In conjunction with the target url users would also need to specify notification interval, the notification interval is useful in that users won't be spammed with notification messages if the ping very frequent e.g. 5 seconds. For instance if the notification interval is set to 1 hour, and users are trying to ping a target url that is down for every minute, and if the target url is down for 2 hours, then users would essentially only receive 2 notification emails (instead of getting one email every minute where the target url is down). Figure 1.0a shows an example of an input payload.

Figure 1.0a
If the URL is pingable then API monitor would set isUp to true (green), otherwise it would set isUp to false and send out a notification to the user. The output payload from API monitor would contain enriched data like the timestamp on which the URL is pinged and also the status of the url.
The returned notification timestamp would be the same as previous notification timestamp if the notification interval has not expired. If the notification interval has expired then it would be updated with new timestamp.
The output json payload would also have the latest timestamp on the current ping attempt. Figure 1.0b shows an example of a JSON output payload.

Figure 1.0b
2.0 Using Flow Designer to Automate Pinging
Now that you have an api monitor that is capable of pinging URLs and sending out notification if the URL is down, next step is to automate the pinging. We can easily achieve this via the new Design Center’s mule flow (assuming that you will be deploying the API monitor into cloudhub). Lets step through on how we can achieve this, first from cloudhub you have to select “Design Center” (depicted in figure 2.0).
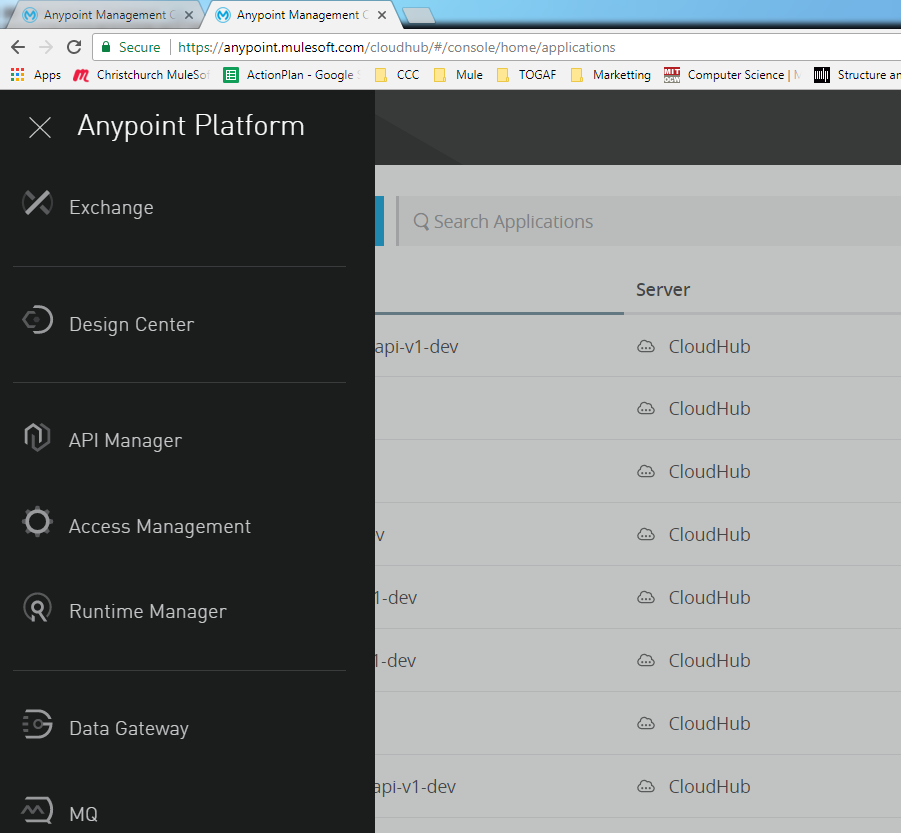
Figure 2.0
When in design center click on create button on your right (Figure 2.0a), and select Mule Application.
Figure 2.0a
You will then be prompted with a pop-up dialog, keyin the same text as per depicted in Figure 2.0b

Figure 2.0b
Select scheduler as the first component and set it to 10 seconds as per Figure 2.0c

Figure 2.0c
Next select a HTTP requester component, key in the URL as per figure 2.0d.

Figure 2.0d
The if you see a text box marked with f(x) on it’s right-hand side, like the one you see at Figure 2.0d, it means that it accepts dataweave expression. Flow designer mule applications runs on mule runtime 4.0, to learn more about it go to the following links below.
All the following links I have shared above is for Mule 4.0. You need to click on the map button beside the f(x) sign (Figure 2.0d). When you click on the map button you will see the following pop up dialog in figure 2.0e.

Figure 2.0e
Click on the script tab and cut and paste your desired payload into the middle pane, and this will be the payload that would be submitted to the API manager every 10 seconds interval to ping the list of URL you have specified in your payload.
When you finish your Flow Desinger configuration it would look like the following figure 2.0f.
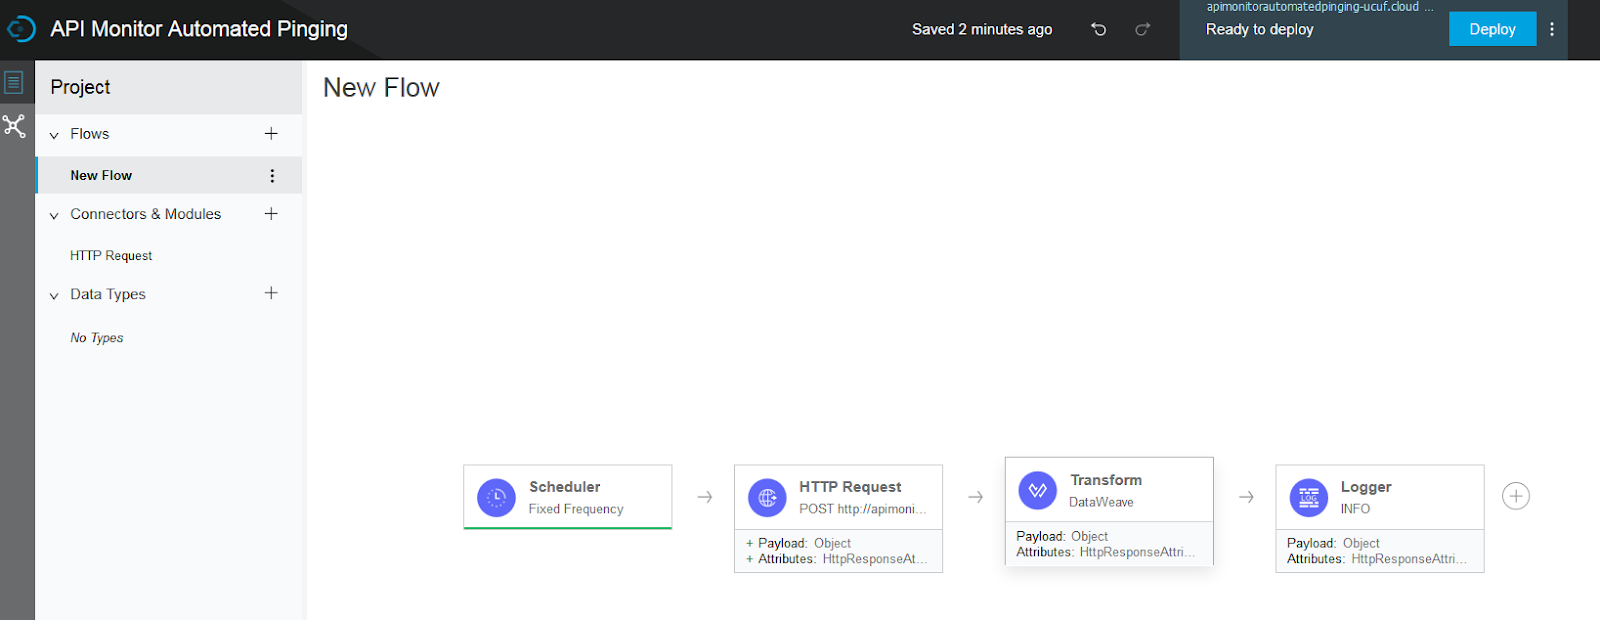
Figure 2.0f
You need to click on the deploy button on the top right of the screen shown in figure 2.0f. Once the application is deployed you will see, the small green marking all the message processors indicating that they have been executed successfully as shown in figure 2.0g.

Figure 2.0g
3.0 Running Flow Designer Application
Right after you click deploy at figure 2.0f, cloudhub would deploy an instance of your flow designer mule application at the runtime manager. If you go to your run time manager in cloudhub you will see your application at Figure 3.0a.

Figure 3.0a
If you click into it, and browse to the Logs Menu at figure 3.0b, you will see the output payload returned by the api monitor application created earlier.

Figure 3.0b
4.0 Conclusion
If you follow all the setup steps in the earlier sections, your flow designer application is actually running on the Design environment. You could download and version your application via the download icon  at the top right of the cloudhub screen, and you could also promote it to other environments by clicking on the promote
  icon. And this is how you could easily automate URL/API monitoring.
the blog is good and Interactive it is about Mulesoft API Developer it is useful for students and Mulesoft Developers for more updates on Mulesoft mulesoft Online training
ReplyDeleteThis information really nice and thank you so much sharing that valuable information and get new skills after refer that post.
ReplyDeleteMulesoft Online Training
Mulesoft Training in Hyderabad
ReplyDeleteThis information is really awesome thanks for sharing most valuable information.
Mulesoft Training in Hyderabad
Mulesoft Online Training
Thanks for sharing valuable information and very well explained. Keep posting.
ReplyDeletelearn mulesoft online
mulesoft training courses
It is amazing to visit your site. Thanks for sharing this information, this is useful to me...
ReplyDeleteMule Training
Mule Certification
Mulesoft Training in Hyderabad
Mulesoft Training in Bangalore
Mulesoft Training Hyderabad
Best Mulesoft Online Training
Best Mulesoft Training
Mulesoft Course Online
Mulesoft Training and Certification
Mulesoft Architecture Certification
Mulesoft Course
Mulesoft Developer Certification
HHHH
ReplyDelete